Digital dashboards
Dashboards for historical and real-time data at our
Groundwater Research and Teaching Observatory
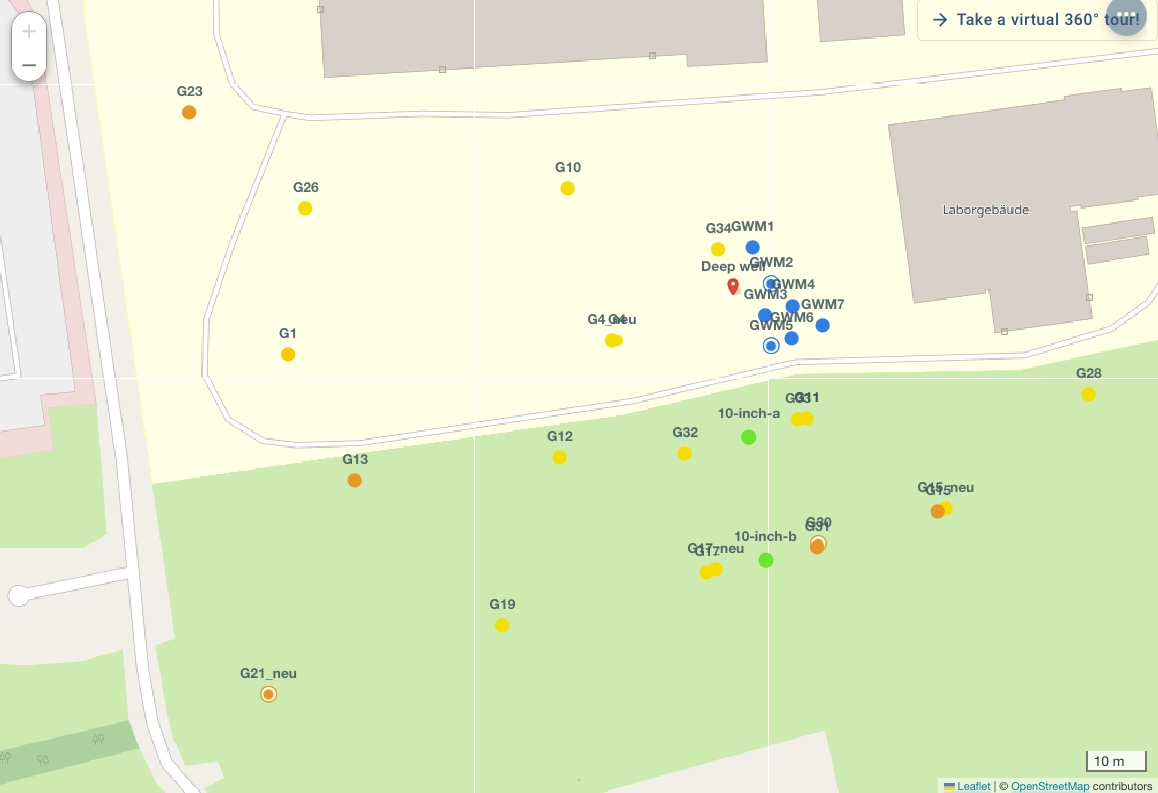
Hydrogeological monitoring
Collection of historical and real-time data on groundwater levels in the monitoring wells.
Visualisation of spatial and temporal trends in groundwater levels across the groundwater monitoring network, enabling long-term aquifer behaviour analysis.
Groundwater level (m a.s.l. / depth below ground)
Hydraulic head time series per well
Well metadata (location, diameter, depth, etc.)

Water quality monitoring
Water quality parameters in groundwater and nearby surface water bodies (Elbe river).
Tracks physico-chemical indicators in groundwater and the Elbe river to assess contamination risks and natural water quality dynamics.
Temperature, pH, electrical conductivity
Dissolved oxygen, redox potential
Turbidity and total organic carbon (TOC/DOC)
Specific parameters of concern (point data)
Sampling location (well number, river)
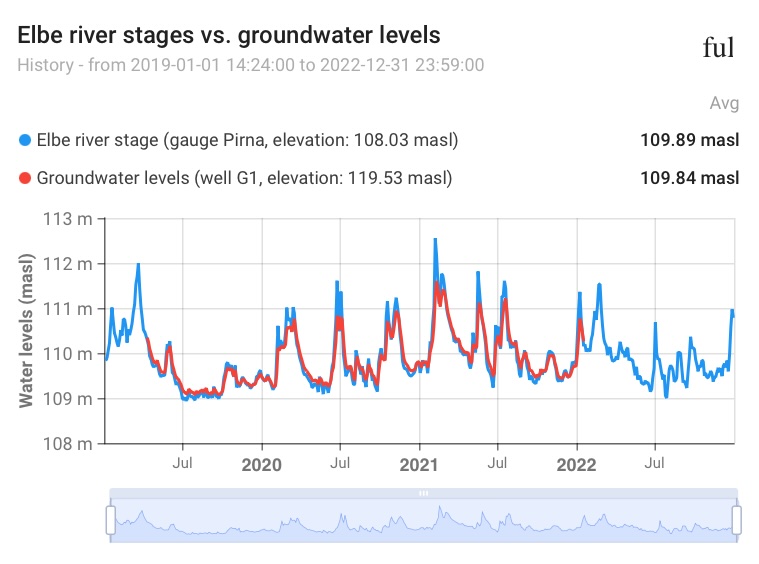
River-groundwater interaction
Real-time and historical comparison of datasets on groundwater levels and Elbe river stages.
Compares groundwater and Elbe river stage to characterise gaining/losing conditions and the influence of river dynamics on the aquifer.
Elbe water level and discharge (gauging station Pirna)
Groundwater levels in near-river wells
Hydraulic gradient between river and aquifer
Bank filtration travel-time indicators
Flood and low-flow event markers
Water temperature in river and wells

Climate vs. groundwater
Combination of meteorological and hydrogeological datasets: rainfall vs. groundwater response.
Correlates meteorological inputs from our local climate station with aquifer response to quantify recharge dynamics and climate sensitivity.
Precipitation /daily/hourly)
Air temperature, humidity, solar radiation, wind
Evapotranspiration values
Groundwater levels
Cumulative water balance / SPI / SPEI indices
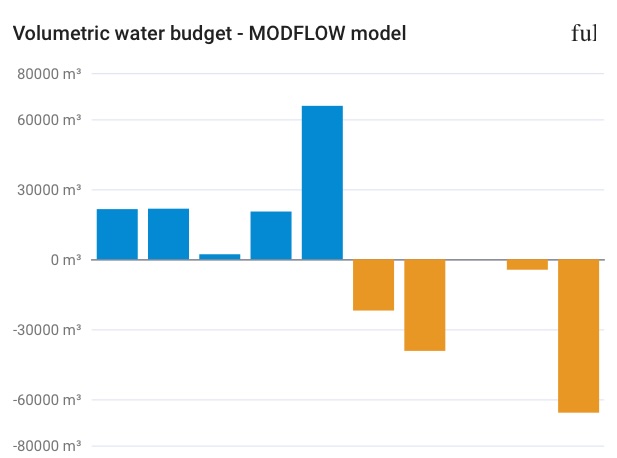
Groundwater modeling
Results of our groundwater flow modeling using MODFLOW at test field site.
Integrates monitoring data with numerical model outputs to visualise flow directions, velocities, and predictive scenarios.
Hydraulic head distribution
Modelled vs. observed heads (calibration plots)
Scenario simulations (pumping, recharge, climate)
Model residuals and uncertainty
Volumetric water budgets
Boundary condition inputs
Vadose zone monitoring
Soil moisture values and other parameters measured in the soil vadose zone.
Bridges the gap between climate inputs and groundwater response by tracking unsaturated zone processes.
Soil moisture profiles and multiple depths
Soil temperature and matric potential
Infiltration front progression
Recharge flux estimates
Managed aquifer recharge
Infiltration rates, recharge volumes, groundwater response during recharge events, recharge scenarios.
Monitors infiltration performance and aquifer response during managed aquifer recharge (MAR) operations, supporting scenario evaluation and optimization.
Infiltration rate and cumulative recharge volume
Source water quality and quantity
Groundwater mounding in observation wells
Infiltration basin / well operation status
Water temperature and clogging indicators
Scenario comparison (planned vs. actual, model outputs)
Pumping and recovery tests
Drawdowns and recovery curves during well pumping and recovery tests, observation well responses.
Displays drawdown and recovery behaviour during aquifer tests to derive hydraulic parameters and assess well performance.
Pumping rate (Q) and duration
Drawdown vs. time in pumped and observation wells
Recovery curves and residual drawdown
Derived aquifer hydraulic parameters
Well efficiency and specific capacity
Tracer tests
Tracer volumes, concentration, flow rates, breakthrough curves, travel times between wells.
Visualises tracer transport between wells to characterise flow paths, travel times, and aquifer heterogeneity.
Tracer type, injected mass/volume and concentration
Coordinates of injection and observation wells
Concentration vs. time (breakthrough curves)
Flow rates and hydraulic gradients during test
Derived parameters (travel time, dispersivity, recovery rate)
Background concentration baseline
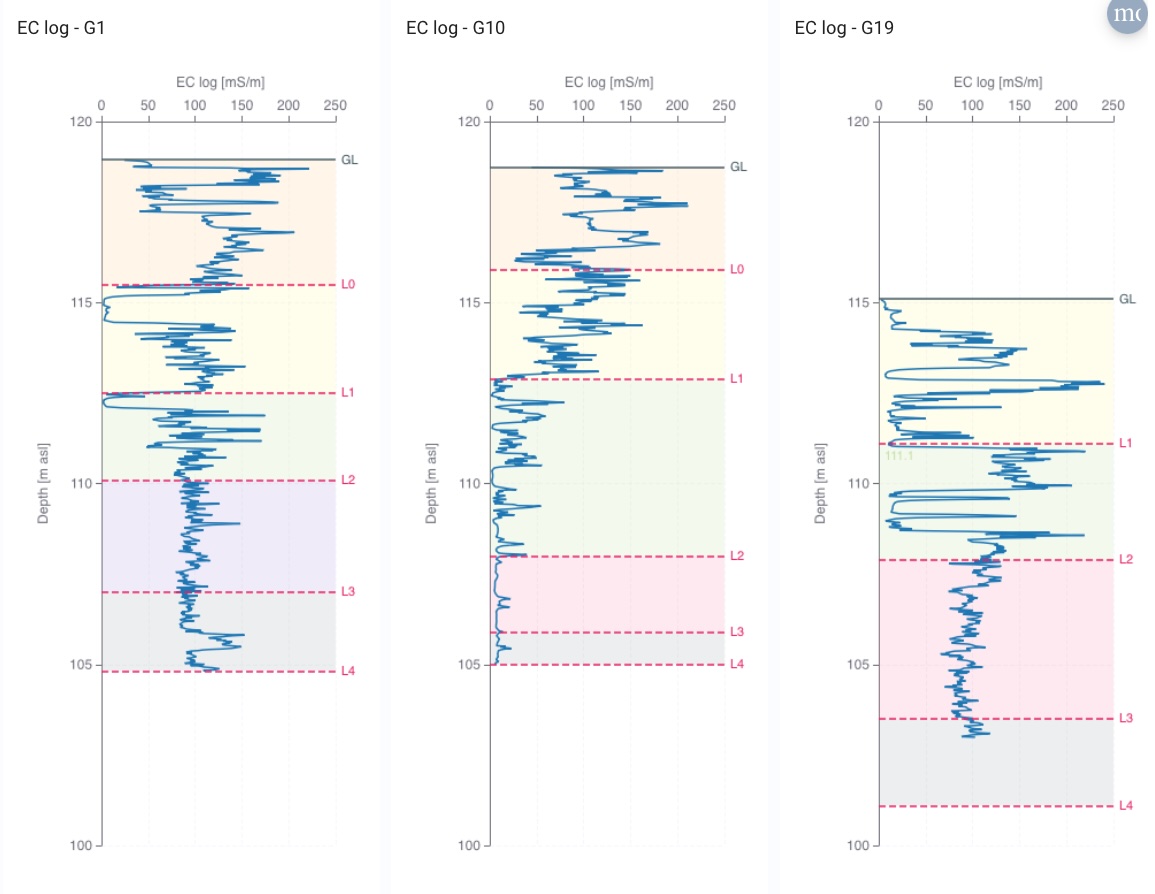
Direct-push EC profiling
Vertical electrical conductivity profiles for characterising the subsurface hydrochemical conditions.
EC profile logs contain continuous measurements of electrical conductivity collected at different depths within a monitoring well. These datasets help identify changes in groundwater salinity, stratification, lithological boundaries, inflow zones, and hydrogeological heterogeneity. EC profiling is widely used in groundwater investigations, environmental monitoring, aquifer characterisation, and managed aquifer recharge studies.
Dashboard →
Sensors and IoT infrastructure
Performance indicators of our monitoring infrastructure: battery status, failure alerts.
Provides operational oversight of the monitoring network to ensure data continuity and rapid maintenance response.
Battery voltage and power status
Data transmission success rate / latency
Sensor calibration status
Active alerts and event logs
Device inventory, firmware version, latest maintenance date
Custom dashboards
Cross-site comparison dashboards, publication-ready reports, data tables and analytics widgets, etc.
Flexible workspace for tailored analyses, cross-site comparisons, and shareable outputs for stakeholders and publications.
User selectable parameters across all datasets
Multi-site overlay and benchmarking widgets
Configurable time range sand aggregations
Statistical and trend analysis tools
Exportable tables, charts and reports (PDF/CSV)
Dashboard-on-demand (user requests)
ThingsBoard.io
Our dashboards were created using ThingsBoard.io, an open-source platform designed for collecting, processing, and visualising data from connected devices and sensors.